Conscape
Research and Data Visualization, 2011
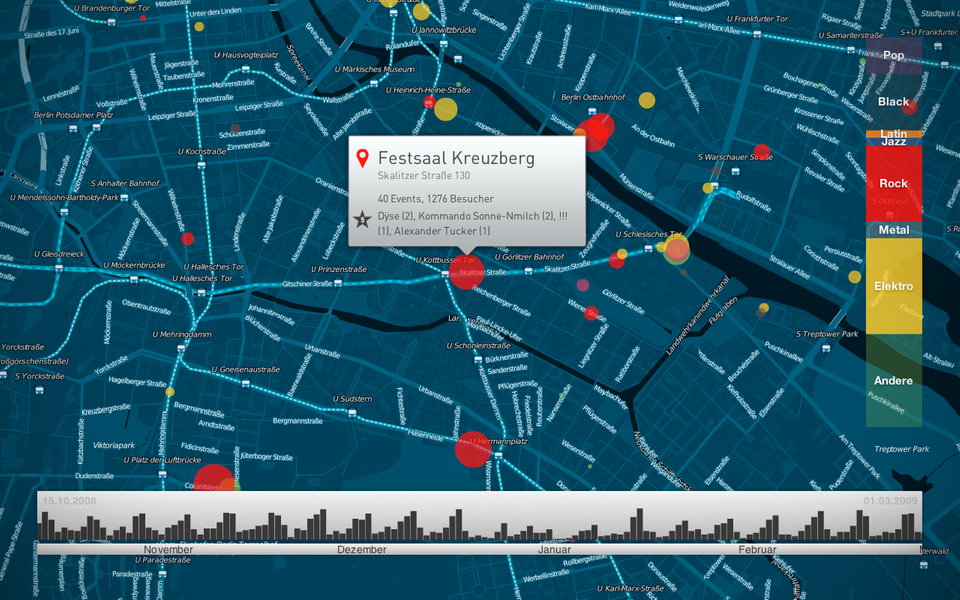
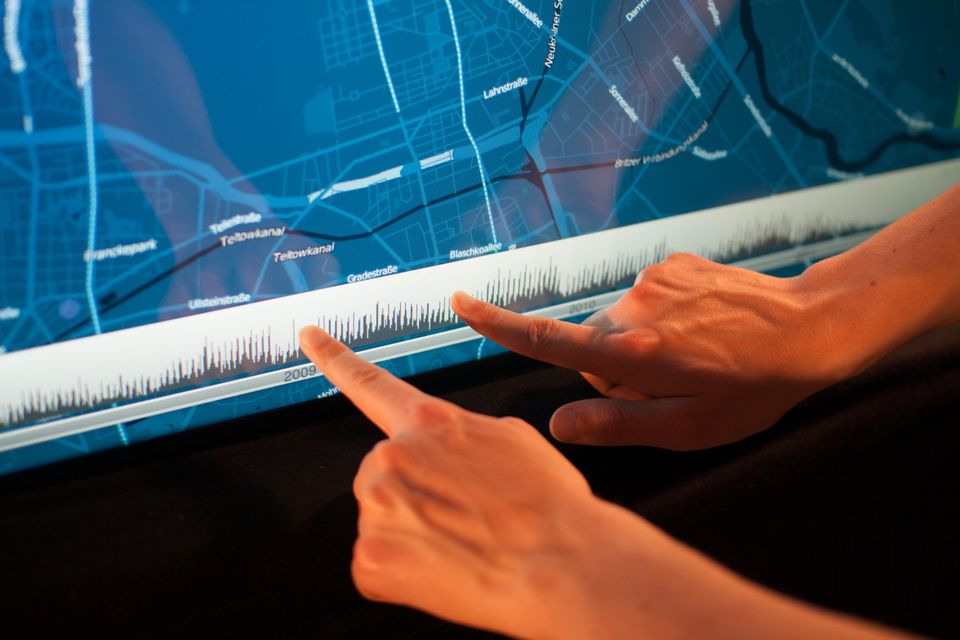
Concept, design and programming of a data visualization on a multi-touch wall display. The prototype was built as an exploration tool of Berlin’s live music scene on an interactive map. It allows to browse all of Berlin’s gigs and spot trends over time.
Each venue is represented by a circle varying in size and color, depending on the amount of visitors and the genre of the artists playing there. By dragging the timeline users can travel through history. Long-term trends as well as weekly and seasonal patterns can be spotted. To get a closer look, the data can be filtered by genre or details on specific clubs can be called up.
Prototype interface
Timeline tool
Technology
#Custom maps, #Multi-Touch, #MySQL, #Web Scraping, #Flash, #OpenRefine
Credits
Collaboration with Florian Schulz and Julian Stahnke
The project was supervised by Till Nagel at the Interface Design program of University of Applied Sciences Potsdam.