Piriharakeke
Geo Visualization and Installation, 2018
Digital map design, UX / UI and programming of interactive maps on a large multi-touch display.
This interactive talks about the heritage of Māori in Te Awahou (Foxton) – Ngāti Raukawa ki te Tonga. It is part of the Generation Inspiration Centre - Piriharakeke – within Te Awahou Nieuwe Stroom in New Zealand – a cultural facility in Foxton.
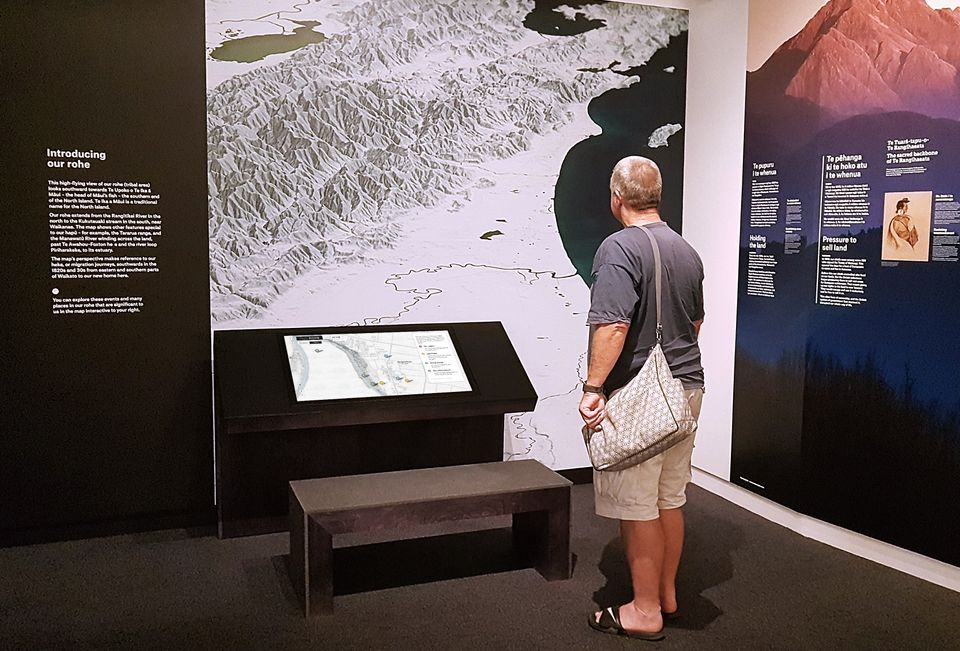
The application has two sections
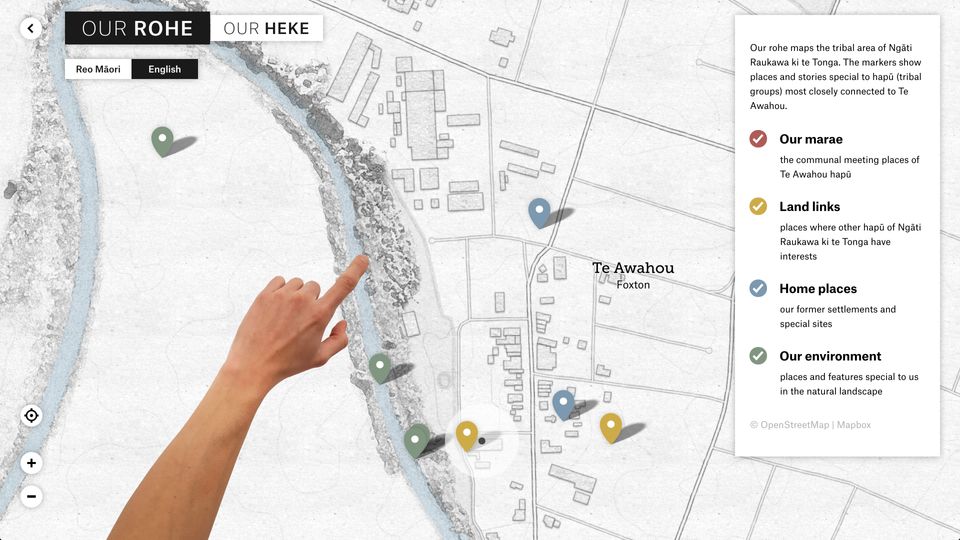
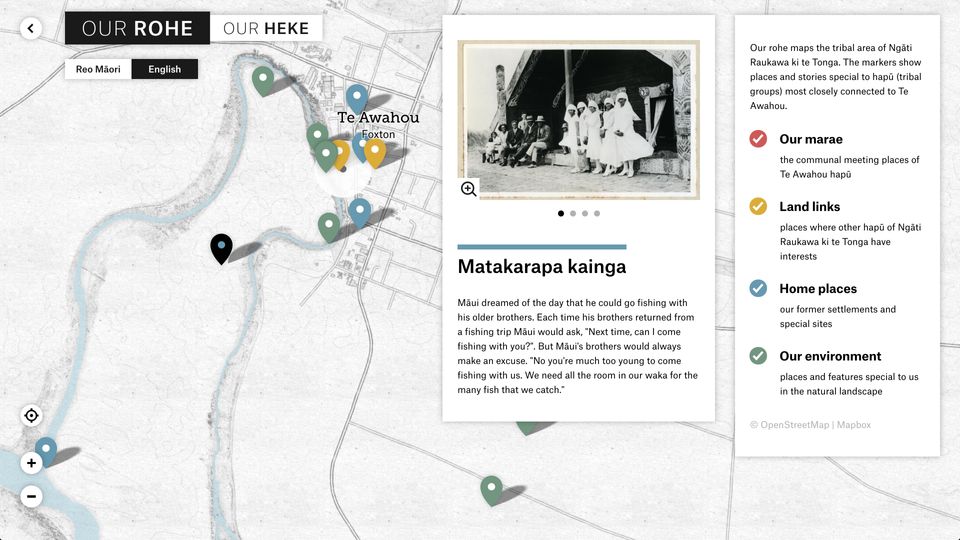
The Rohe (tribal area) section explores the stories of Te Awahou (Foxton), part of the rohe of Ngāti Raukawa ki te Tonga. It’s about the places special to their hapū (tribal groups).
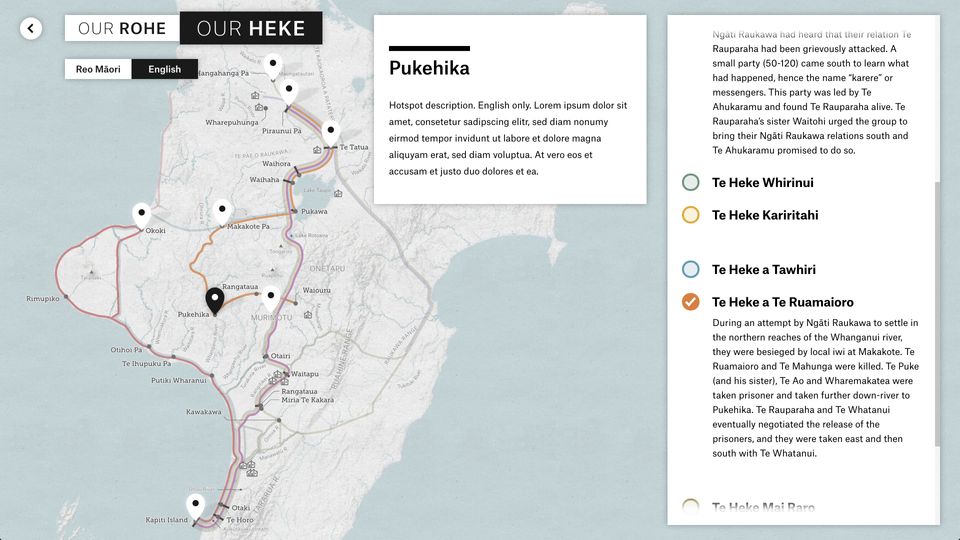
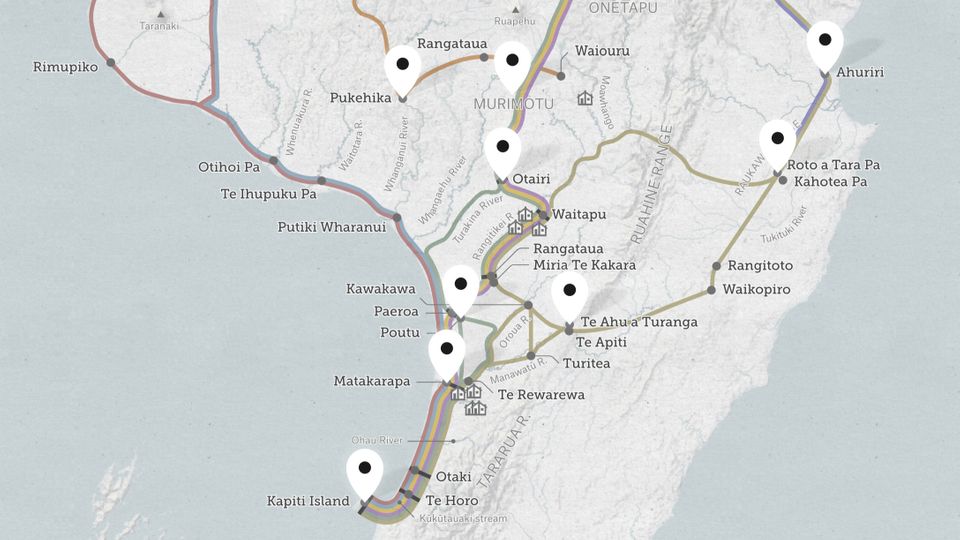
In the Heke (migration journeys) section, visitors can trace the migration journeys of Māori ancestors who travelled hundreds of kilometres south to make their new home in Te Awahou (Foxton).
I also worked on another interactive in the Foxton Community Hub, a digital diorama, which discusses the unique situation of the Manawatu river that used to run through the city.
map design
The core part of this interactive is the map on which all information is displayed. I modified Mapbox’s pencil style, highlighting rivers and the sea, shifting roads and houses in the background and using more detailed terrain data.
A custom layer of satellite data was added for more texture. The tiled data was downloaded and stitched to one large image. It was then manipulated and manually masked in Photoshop. The resulting image was geo-referenced in QGIS and baked into the map tiles.
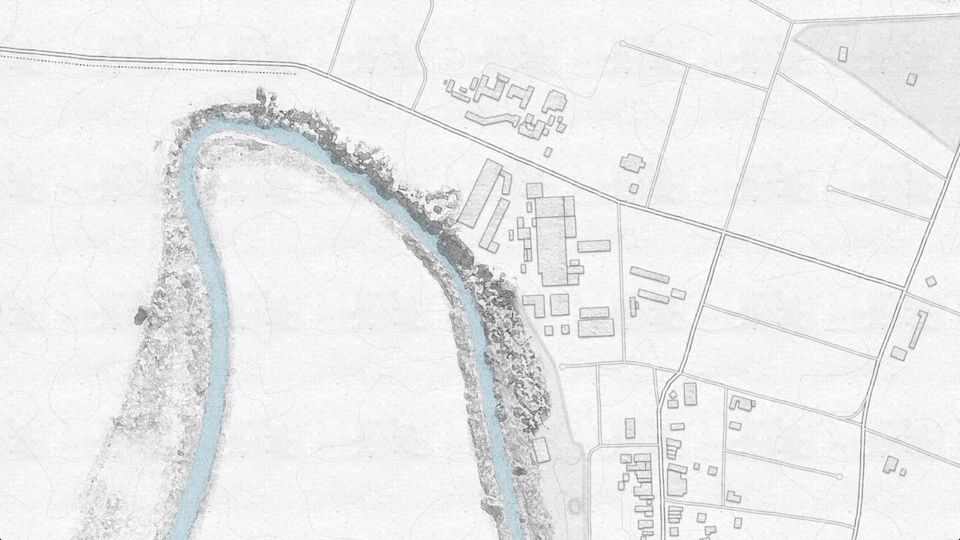
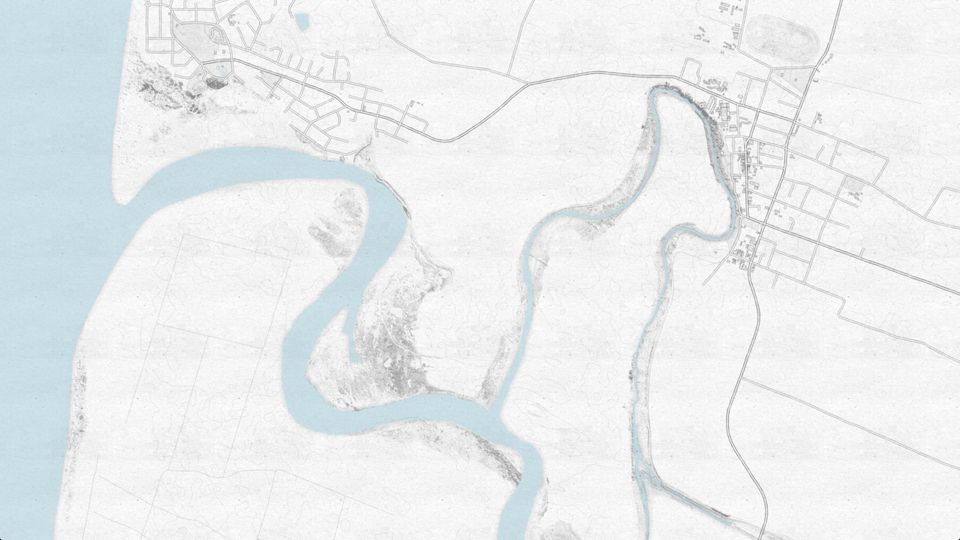
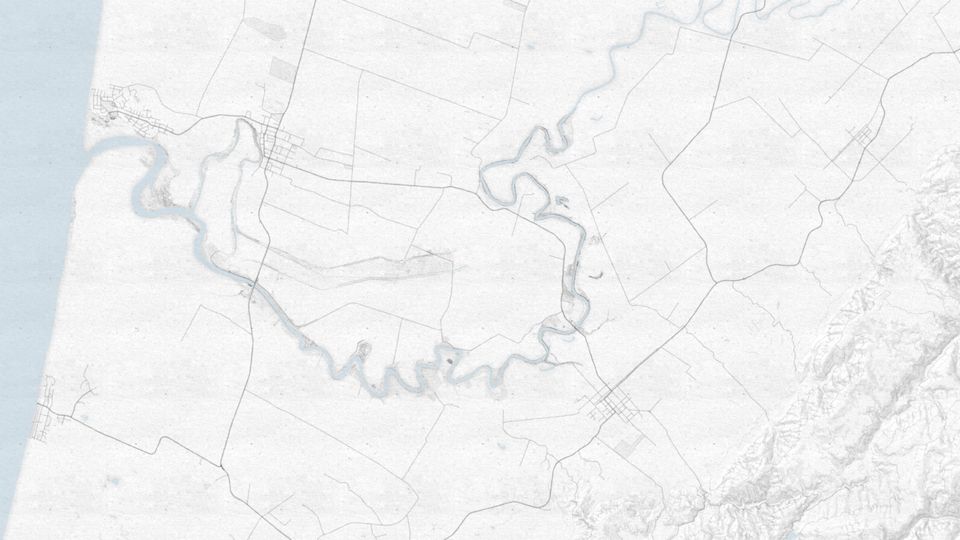
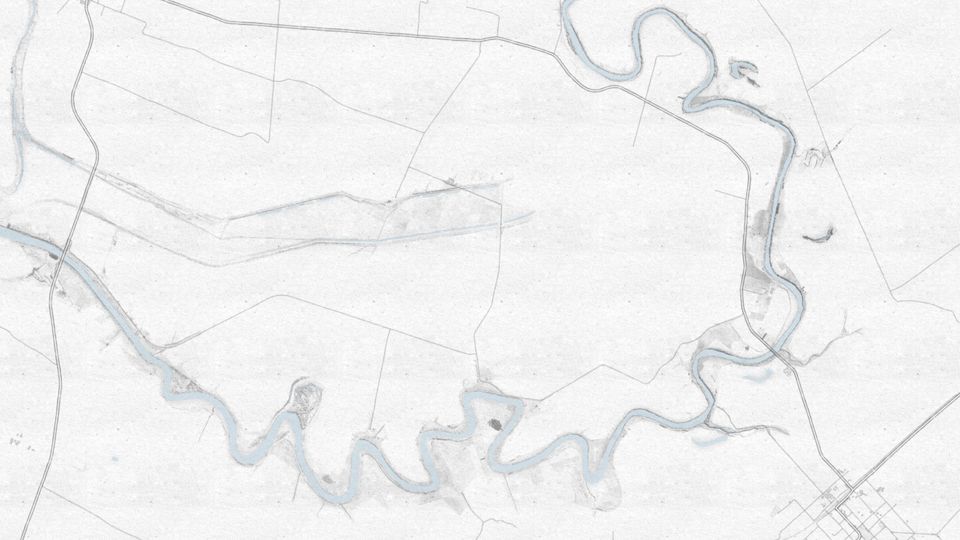
different implementations to each map
The app uses web technologies, mainly JavaScript, and is backed up by Node.js on the server-side.
The Rohe section has a lot of hotspots with stories and images to explore. Those fit well on a zoomable map implemented using Leaflet.
One of the challenges was to provide the map for offline access. I ended up using tl (which provides an alternative interface for Mapbox Studio classic’s underlying framework tilelive.js) to download and mbtiles-server to deliver the tiles.
For the animated routes in the Heke section, I chose a different approach, since it is less populated it didn’t have to be zoomable.
The routes were first hand-drawn on a paper map by the researchers, then digitised with QGIS and later optimised and improved using Adobe Illustrator. This way it was possible to align the routes nicely.
Technology
#Multi-Touch, #JavaScript, #Node.js, #GIS, #CartoCSS, #Leaflet
Credits
Production and delivery: Workshop e
Concept: Tedd Mawson, Workshop e
Content Research: Heeni Collins, Te Kenehi Teira and iwi representatives, Pamela Lovis, Workshop e
Image Research: Katie Sims, Workshop e
Wall map: Tedd Mawson, Workshop e